
MapViewer is a new tool for viewing genetic maps on GDV. It can be accessed from the Tools menu in the header (Fig. 24A), the Species Overview page (Fig. 24B), or the Map Overview page. The Map Overview page displays a summary graphic of all linkage groups (Fig. 24C) and clicking a linkage group opens a more detailed view in MapViewer.
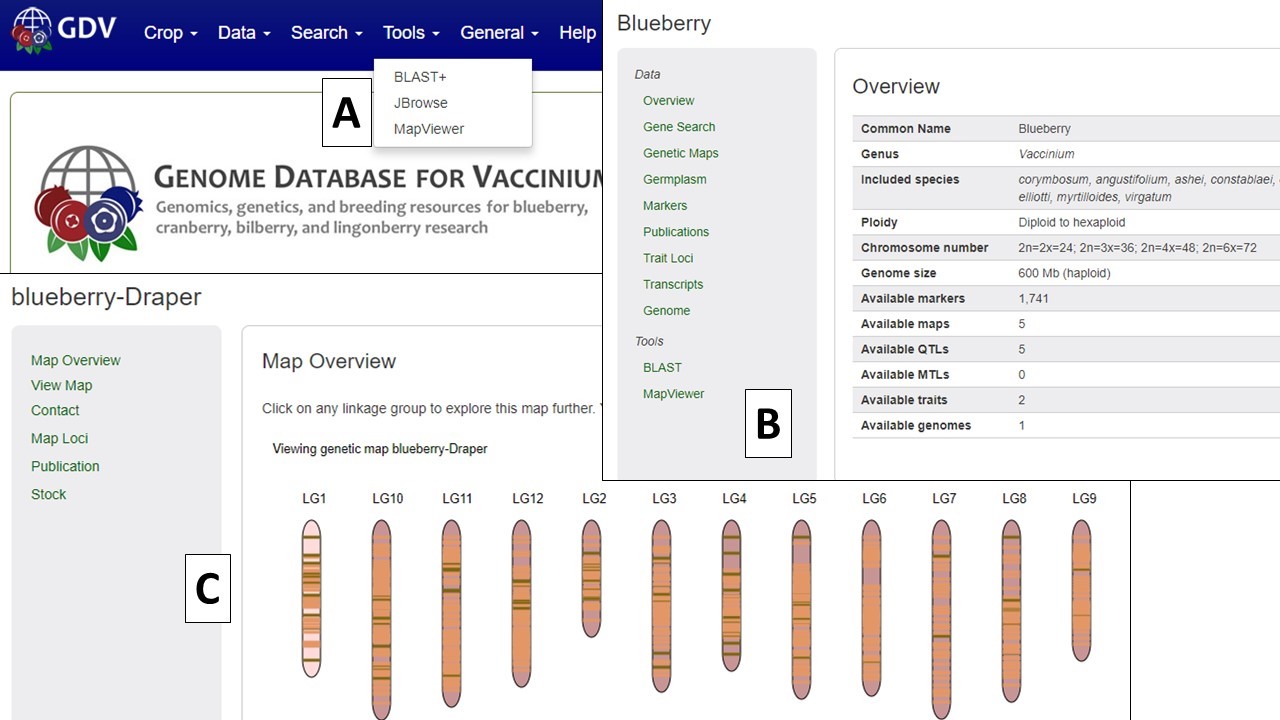
Figure 24. Different ways to open MapViewer.
MapViewer displays the complete linkage group on the left, and the selected region on the right (Fig. 25). The selected region can be changed by dragging and resizing a window on the complete linkage group on the left side. There is a legend of the marker colors below the linkage group figure (Fig. 25A). Information about the markers is displayed in the upper right corner when the pointer is over a marker name on the right side graph. Clicking on the marker name on the rights side graph, opens the marker details page.
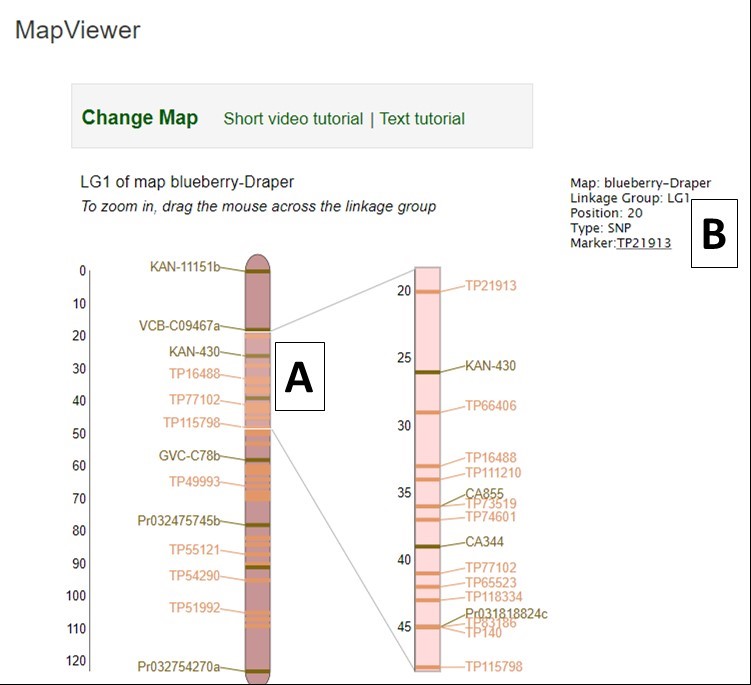
Figure 25. MapViewer displays a static linkage group graph on the left and a dynamic graph on the right.
A different map or linkage group can be displayed using the controls at the bottom of the MapViewer page (Fig. 26A). The color of the markers and which markers are displayed can be changed with the controls (Fig. 26B). The ruler and marker positions can also be toggled on or off (Fig. 26C). After changing any of the four parameter sections, the Submit button must be pressed to display the changes.
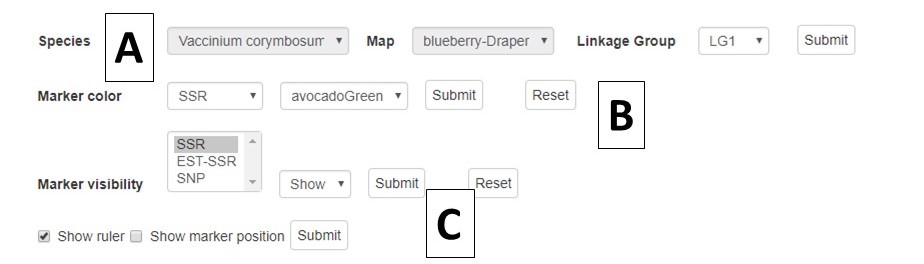
Figure 26. MapViewer control panel.