
GDV has the Tripal Analysis Expression module to view differential expression values from RNA-seq experiments. Information about the different expression datasets on GDV is linked from the Crop pages. Expression data for the genome associated mRNAs or assembled transcriptome contigs is visualized either on the associated feature page, or by creating a heatmap.
To search and find the mRNAs or contigs associated with the expression datasets, go to the "Search" menu and choose "Search Gene and Transcripts". Select the dataset (i.e. "Vaccinium corymbosum genome sequence" or "Vaccinium virgatum transcriptome") and then further refine the search if desired. Features that have expression data (mRNA for genome, contig for transcriptome), will have an "Expression" category on the left hand menu of the feature page (Fig. 27A).
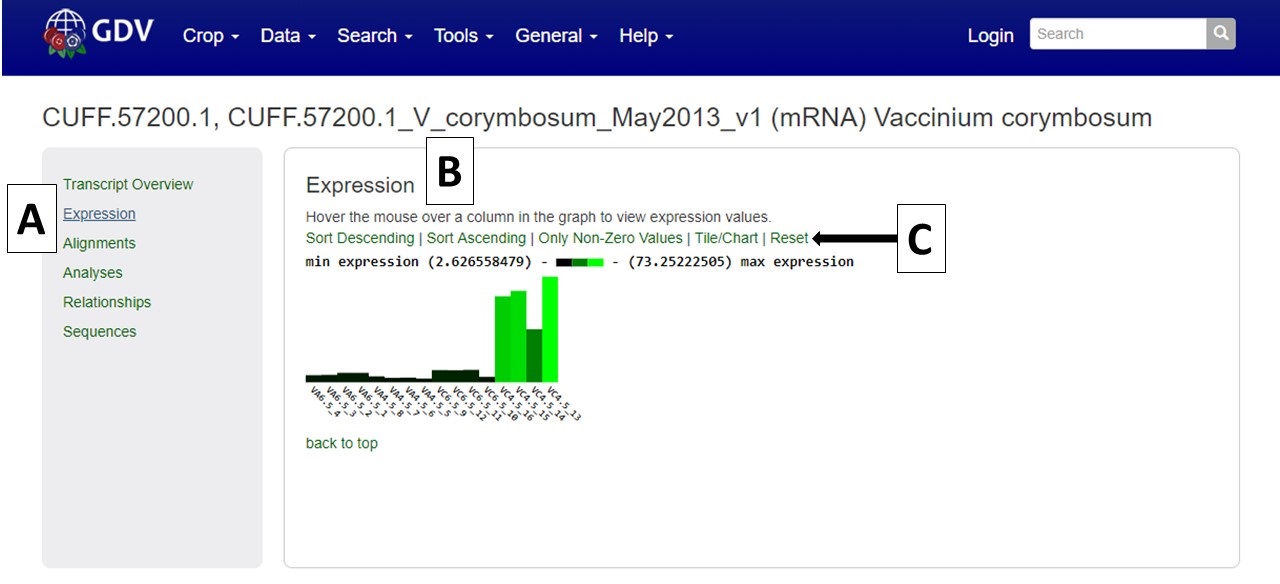
Figure 27. Expression pane on feature page.
When "Expression" is clicked, the center pane will change to display the available expression data (Fig. 27B). Hovering over the bars on the chart displays the expression value and more infomation about the sample. Clicking on the bars will open the information page for the biomaterial, which has links to the analysis details page. There are also options to sort or edit the display of the expression data (Fig. 27C). The data can be sorted by ascending/descending values, only non-zero values, and the chart can be changed from a bar chart to a tile chart.
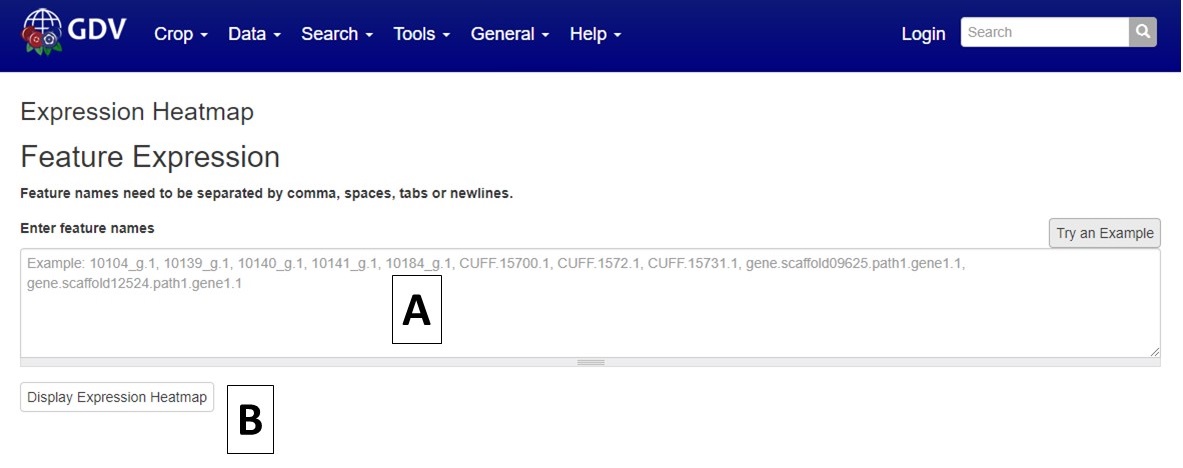
Figure 28. Expression Heatmap interface.
The expression data can also be viewed as a heatmap. To generate a heatmap, a list of feature names needs to be collected and input into the heatmap interface. Paste the list of feature names into the box (Fig. 28A) and click "Display Expression Heatmap" (Fig. 28B). The heatmap will then be displayed on the bottom half of the page.
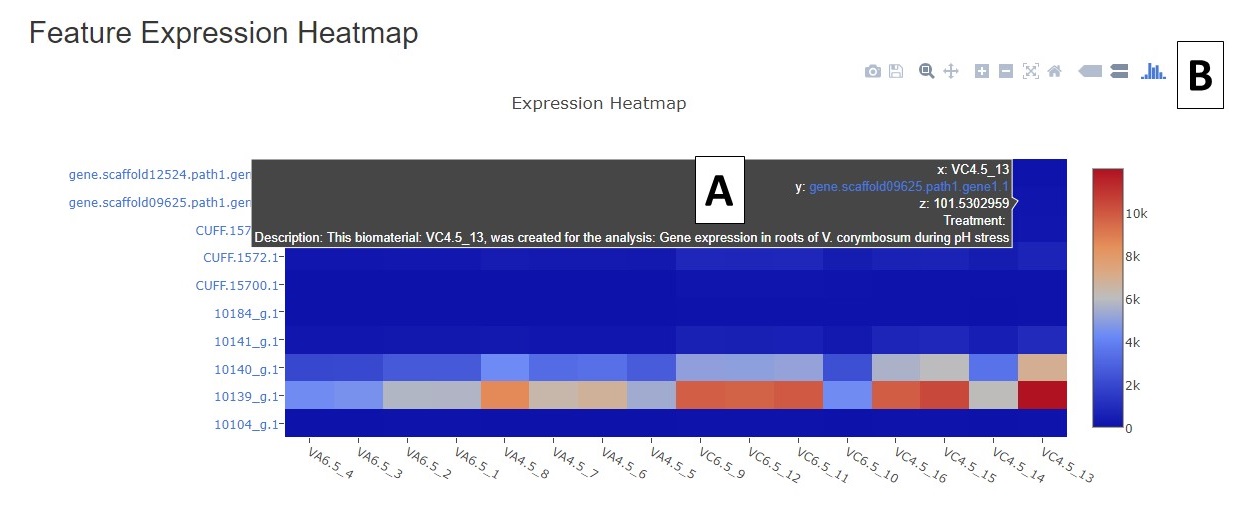
Figure 29. Example heatmap.
The heatmap has the feature names (with hyperlinks) on the y-axis and the biomaterial names on the x-axis. When the mouse hovers over a heatmap square, a summary of the data is shown (Fig. 29A). There are also heatmap display/export options that appear when the mouse hovers in the upper right corner (Fig. 29B).