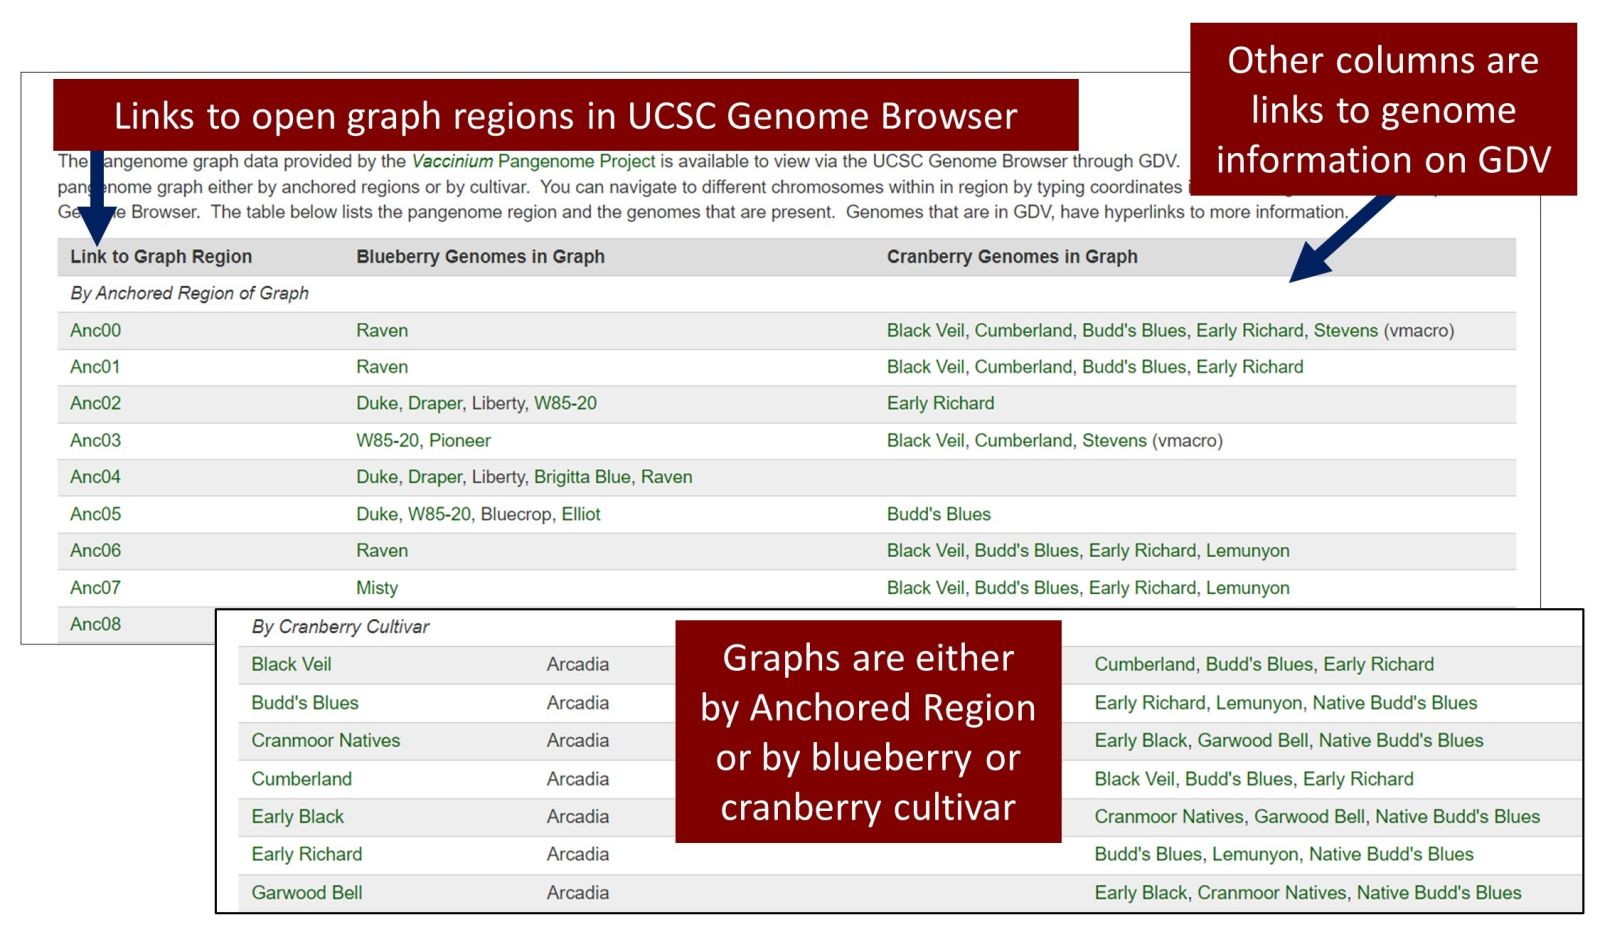
The graph data is available on GDV using the UCSC Genome Browser which has a variety of tutorials. But to help get you started, let’s go over some basics. The data that is displayed is a HAL (hierarchical alignment) graph that was provided by the authors and then processed to be displayed in the UCSC Genome Browser. The HAL file has been split into anchored regions and displays alignments anchored to those regions or a certain genome. Links to all these alignements are found on this page (see picture below).
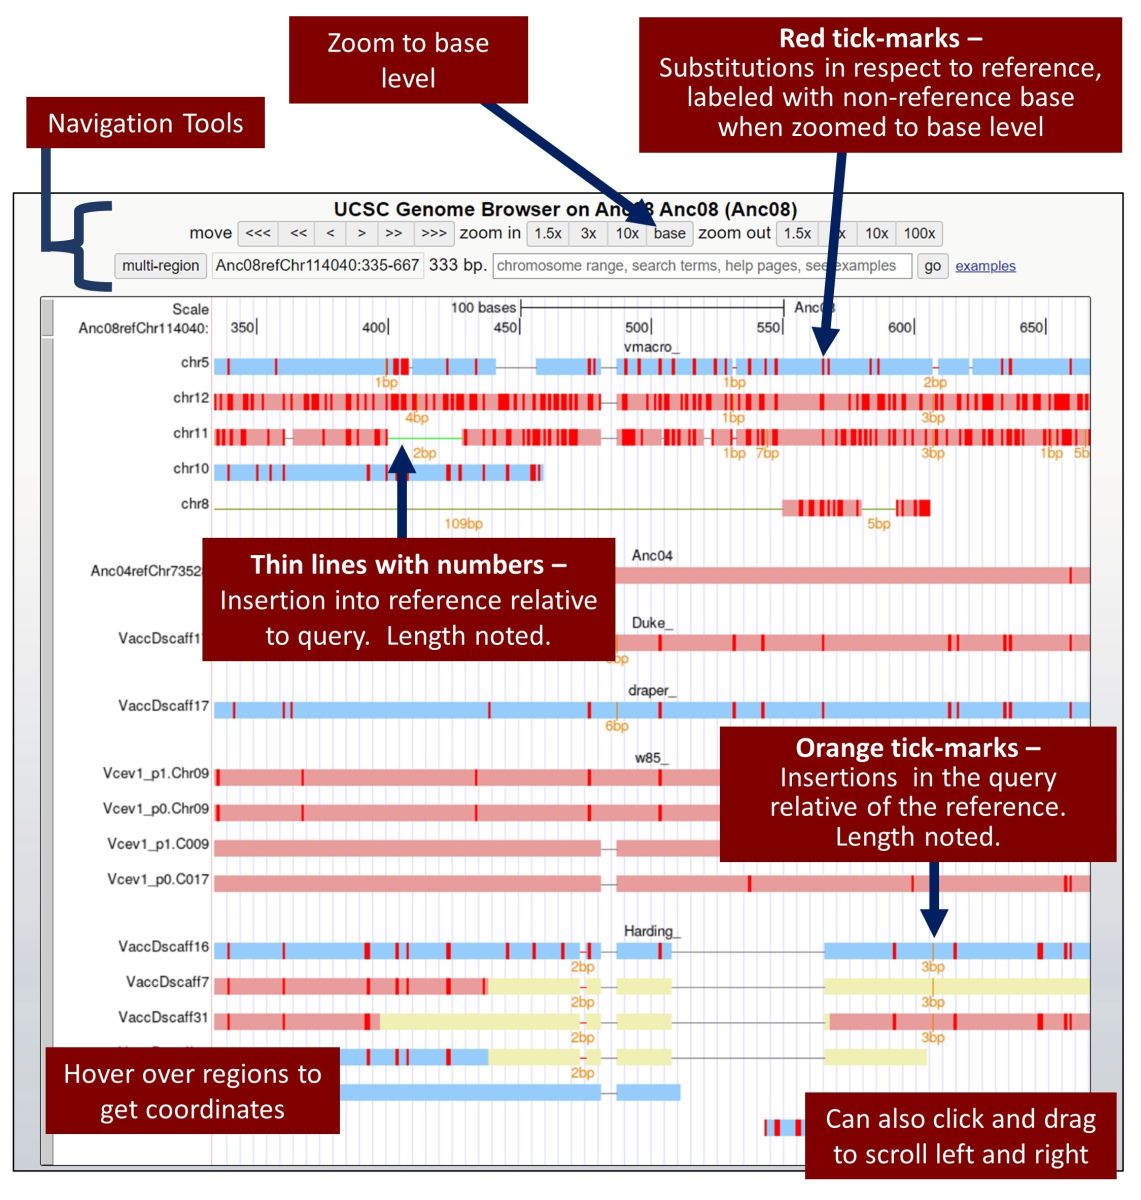
Here is another picture noting the the pangenome graph color-coding and navigation.